Author Bio: Danielle Canstello is part of the content marketing team at Pyramid Analytics. They provide enterprise-level analytics and BI solutions. In her spare time, she writes around the web to spread her knowledge of the marketing, business intelligence, and analytics industries.
Any investment in your business needs to be evaluated to determine its efficiency and effectiveness. A pay-per-click (PPC) advertising campaign is no exception.
It’s not always easy to measure whether a PPC campaign is working. If you’re a business owner or support a business in its PPC efforts, you can’t just launch a campaign and sit back and expect customers to roll in.
It’s important to analyze whether your business is getting a high return on investment (ROI) on a PPC campaign. So let’s look at some Key Performance Indicators (KPIs) that will help you examine the ROI of your campaign efforts.
Start With Your Goals
As with any business strategy, you need to start with goals. They may be different depending on your PPC campaign, but they should be established each time. Examples include boosting traffic to your website or converting leads to sales.
With the wide variety of metrics available to you, it’s important to know your goals so you know what metrics, or KPIs, you will want to analyze.
Top 8 KPIs to Measure
Metrics abound for any campaign, so once your goals are established, here are the top KPIs to consider tracking and analyzing to measure the ROI of your campaign.
1. Impressions and Clicks
While clicks are not the “be-all and end-all” to measure the success of a campaign, you won’t have any success without clicks.
Every conversion in your campaign will start with:
- Impressions: the number of time an advertisement is displayed; and
- Clicks: the number of times an advertisement is clicked on.
These metrics, therefore, are an early indicator of the success of a PPC campaign. A high number of clicks means the ad was attractive enough to generate click-throughs, and if clicks are increasing, it could be a good time to increase the ad budget. If clicks are decreasing, it may mean the ad needs additional work.
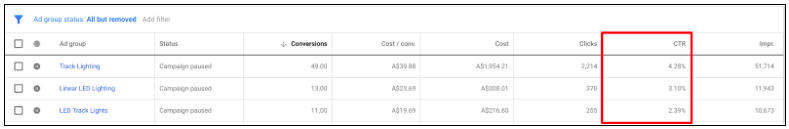
2. Click-Through Rate (CTR)
Using the data generated by impressions and clicks, you can determine the click-through rate (CTR). This metric is calculated by dividing the number of clicks by the number of impressions.
For instance, if your ad was displayed 1000 times, and was clicked on 100 times, your CTR will be 10 percent.
What’s considered a successful CTR can vary by industry, so it’s important that you have a target for a successful CTR for your campaign. If you’re still debating a goal, you can start with industry standards, and Wordstream can provide you with information on those. From that, you can determine what’s best for your business.
If your CTR rate meets or surpasses your goal, it means your campaign resonates with your audience. If your CTR is lower than your goal, you will need to review your ad and evaluate your use of keywords, the appeal of the ad, the clarity of the message, and other factors.
3. Impression Share
This metric will tell you the number of impressions received by your advertisement compared to the number of times it was eligible to receive impressions, which also generates an equally important metric of lost impression share.
For instance, if the total number of searches performed for your advertisement’s keyword was 1000, but your ad was only displayed 700 times, it means you had a 70% impression share and a 30% lost impression share. This also allows you to calculate the clicks and conversions that could have been received if that 30 % of lost impressions were actually displaying your ad.
It also means your competitors are generating the other 30% of impression share, which you want to cut into. If you increase your impression share, you will decrease the impression share of the competition, or the number of times your competitors’ ads are shown.
Using this data, you can decide to increase your overall PPC budget or raise bids, for instance.
4. Cost Per Click
This metric is the average amount you pay per ad click. It can be calculated by dividing the total cost of a campaign by the number of times the ad was clicked on. Again, an ideal CPC can vary by industry, but if you set a goal, this will help you measure your success against your goal.
A companion metric is Cost Per Impression, or the percentage of people who actually convert after clicking on an ad compared to the number of times the advertisement is shown.
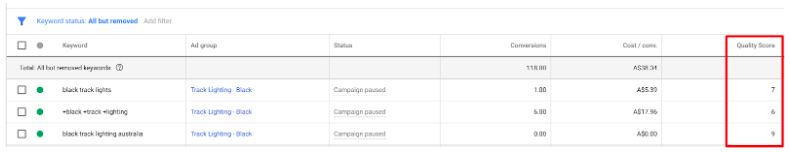
5. Quality Score
This metric is a number that Google generates to tell you the relevancy of your advertisement, by looking at the past CTR of your keyword, the relevancy of your keywords and the quality of your landing page.
A high quality score means that the keyword and landing page are relevant to the person who looked at your advertisement. Google will then use that score to determine the ranking of the ad and be sure that the highest positions go to the most relevant ads.
This can be a more elusive KPI because it is less easily understood compared to a metric like number of clicks or click-through rate. But it’s an important measure because a good quality score basically means you pay less money to advertise, and a poor score means you pay more. Ways to positively impact your score include refining keyword choices and landing page quality.
6. Conversion Rate
This is a crucial KPI in measuring the return-on-investment of your campaign. This metric tells you how many users not only clicked on the ad but also completed the action you wanted them to complete when you created the ad. Examples include signing up for your email service or purchasing a product.
This metric is expressed as a percentage and calculated by dividing the number of conversions the campaign received by the total clicks. So, if your campaign has 100 clicks and 10 conversions, your conversion rate is 10%.
Once again, determining quality conversion rates can vary by industry, so you will be measuring this result against the goals established for your campaign. The key is to translate the campaign into a meaningful result for your business.
Ways to improve the conversion rate of your ad include:
- Ensuring your landing pages perform well on every type of device, including hand-held devices.
- Keeping forms and buttons visible, such as at the top of the page, to allow easy access for customers.
- Adding a video to the landing page.
- Displaying high-quality images on the landing page.
It makes sense that the more attractive the landing page, the better chance you have of converting those customers who arrive there.
Companion data to this score is known as Wasted Spend. This metric is the opposite of the conversion rate, as it measures the amount of campaign money you’re spending that does not result in conversions.
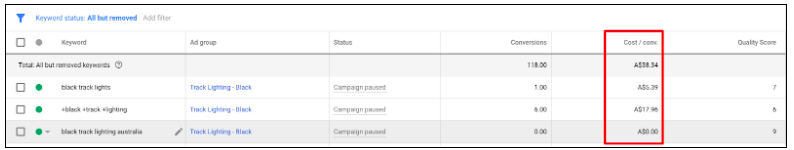
7. Cost Per Conversion
This is another important metric that tells you the amount spent to convert a customer, whether that’s to obtain an email sign-up or a generate a sale. It’s calculated by dividing the total cost of conversions by the number of conversions.
For instance, if you spent $100 on a campaign and generated 4 sales, your cost per conversion would be $25.
You have to determine your ideal cost per conversion, based on how much value you place on that conversion, be it a sale or an email sign-up. If you’re paying more to gain a customer than the value or profit gained from that customer, it means your campaign is not generating a valuable ROI for your business.
8. Return on Advertisement Spend
This metric determines the value and outcome of your advertising campaign by calculating the revenue earned for every dollar spent. The higher the return on advertisement spend (ROAS), the higher the return.
This is calculated by dividing the cost of the campaign by the profit from the campaign. As an example, let’s say you spent $1000 on a campaign over one month and gained $2000 in revenue. This means that for every dollar you spent, you generated $2 in revenue.
Again, it’s up to you to determine the target, but you should have a goal of at least reaching a break-even point – which is $1 in revenue for every $1 spent on advertising - so that at the very least, the campaign does not lose money.
The ROAS metric will tell you how your advertising and marketing efforts contribute to the bottom line of your business. It will also help set sights on future budgeting and marketing efforts.
A companion metric is a total ROI, which is calculated by adding in all the costs of an advertising campaign, and not just the campaign costs related to ad purchases, for instance. In this metric, you include all costs for production such as salaries, shipping costs, etc.
Final Thoughts
These 8 metrics are a great cross-section of the KPIs you can use to measure the efficiency and effectiveness of your PPC campaign.
There are some considerations around measuring KPIs, so it’s important not to focus on just one measure. As well, the metrics chosen should relate to your goals.
For instance, if you want to rank at the top of Google search results, you should be looking at total impressions (Number 1) and impression shares (Number 3).
If you want to increase your conversion rate, you should be watching metrics for click-through rate (Number 2), cost per click (Number 4), and conversion rates (Number 6).
As well, KPIs often work together. Your click-through rate will impact your quality score because the two are related. Improving your CTR can positively impact your quality score, which will in turn positively impact your cost per click and cost per acquisition.
These Key Performance Indicators will help you measure your PPC campaign while making adjustments and improvements along the way.