Google Data Studio is a free tool by Google, of course, that allows you to turn your data into shareable, beautiful, and useful reports that can be completely customized.
You can add a timeline, charts, geo maps, different types of graphs, data tables, pivot tables, and more.
Among other things you can do with Google Data Studio are interactive reports with filters and range controls that the viewer can use to request the data they need.
Plus, you can add links, videos, and images to create product catalogs, libraries, and anything you need for your business.
The most significant thing is that it is a customizable tool, meaning that you can add your brand colors, logo, and style. Therefore, you will create a branded report very different from what other data-processing programs can deliver.
Why is Google Data Studio useful today for virtually any company?
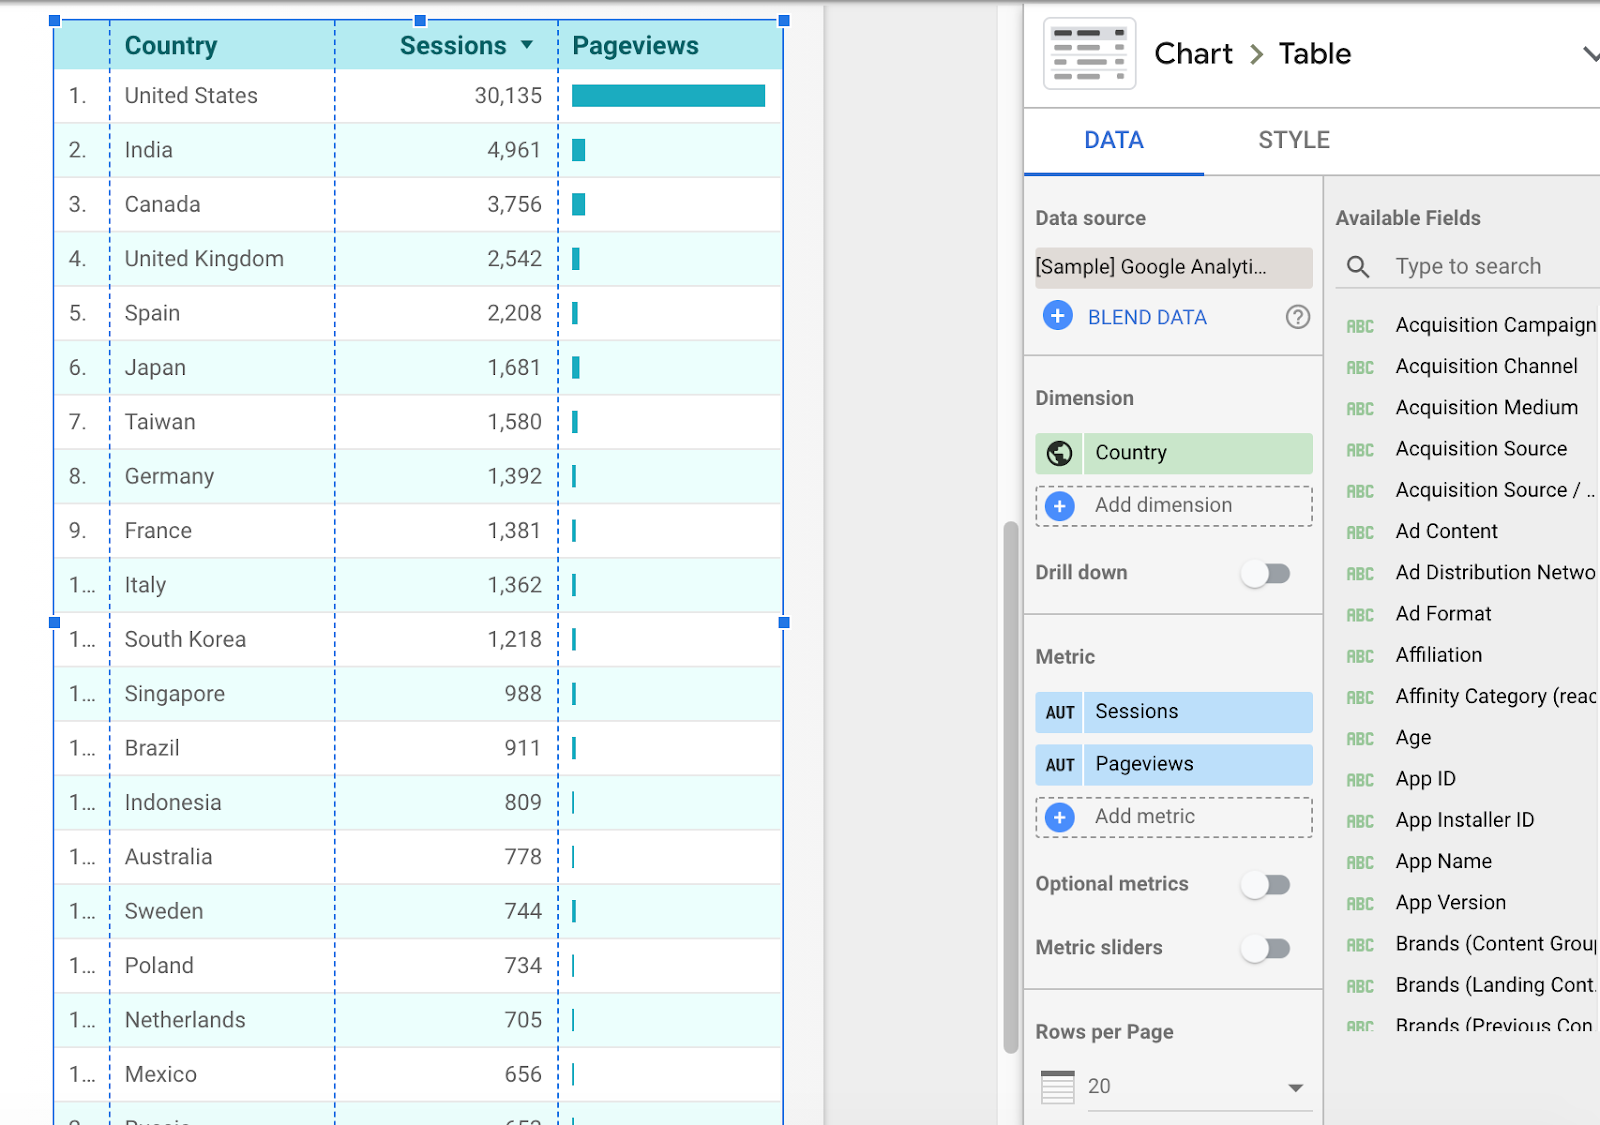
The main reason is that it helps you manage data and turn it into something that can be consumed visually and understood by a wide range of people. It allows you to turn this:
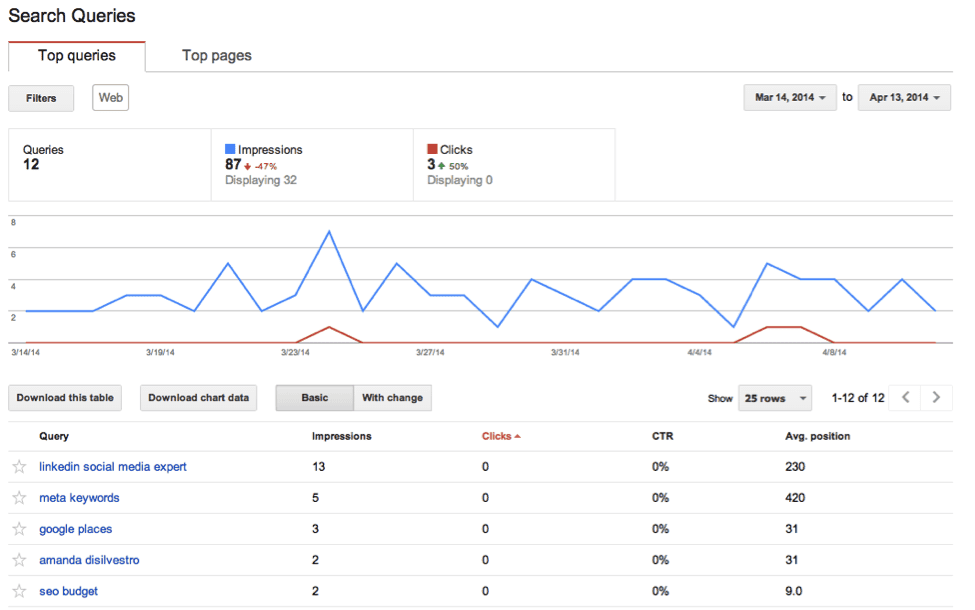
Or this:
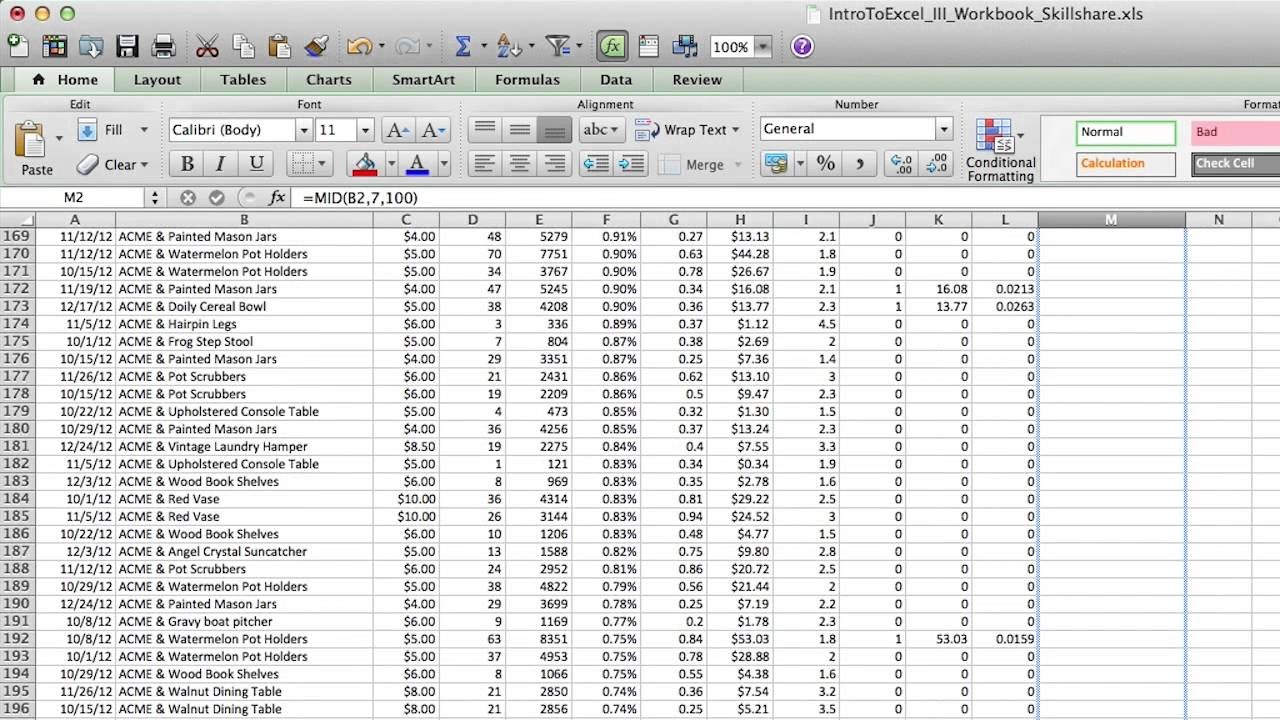
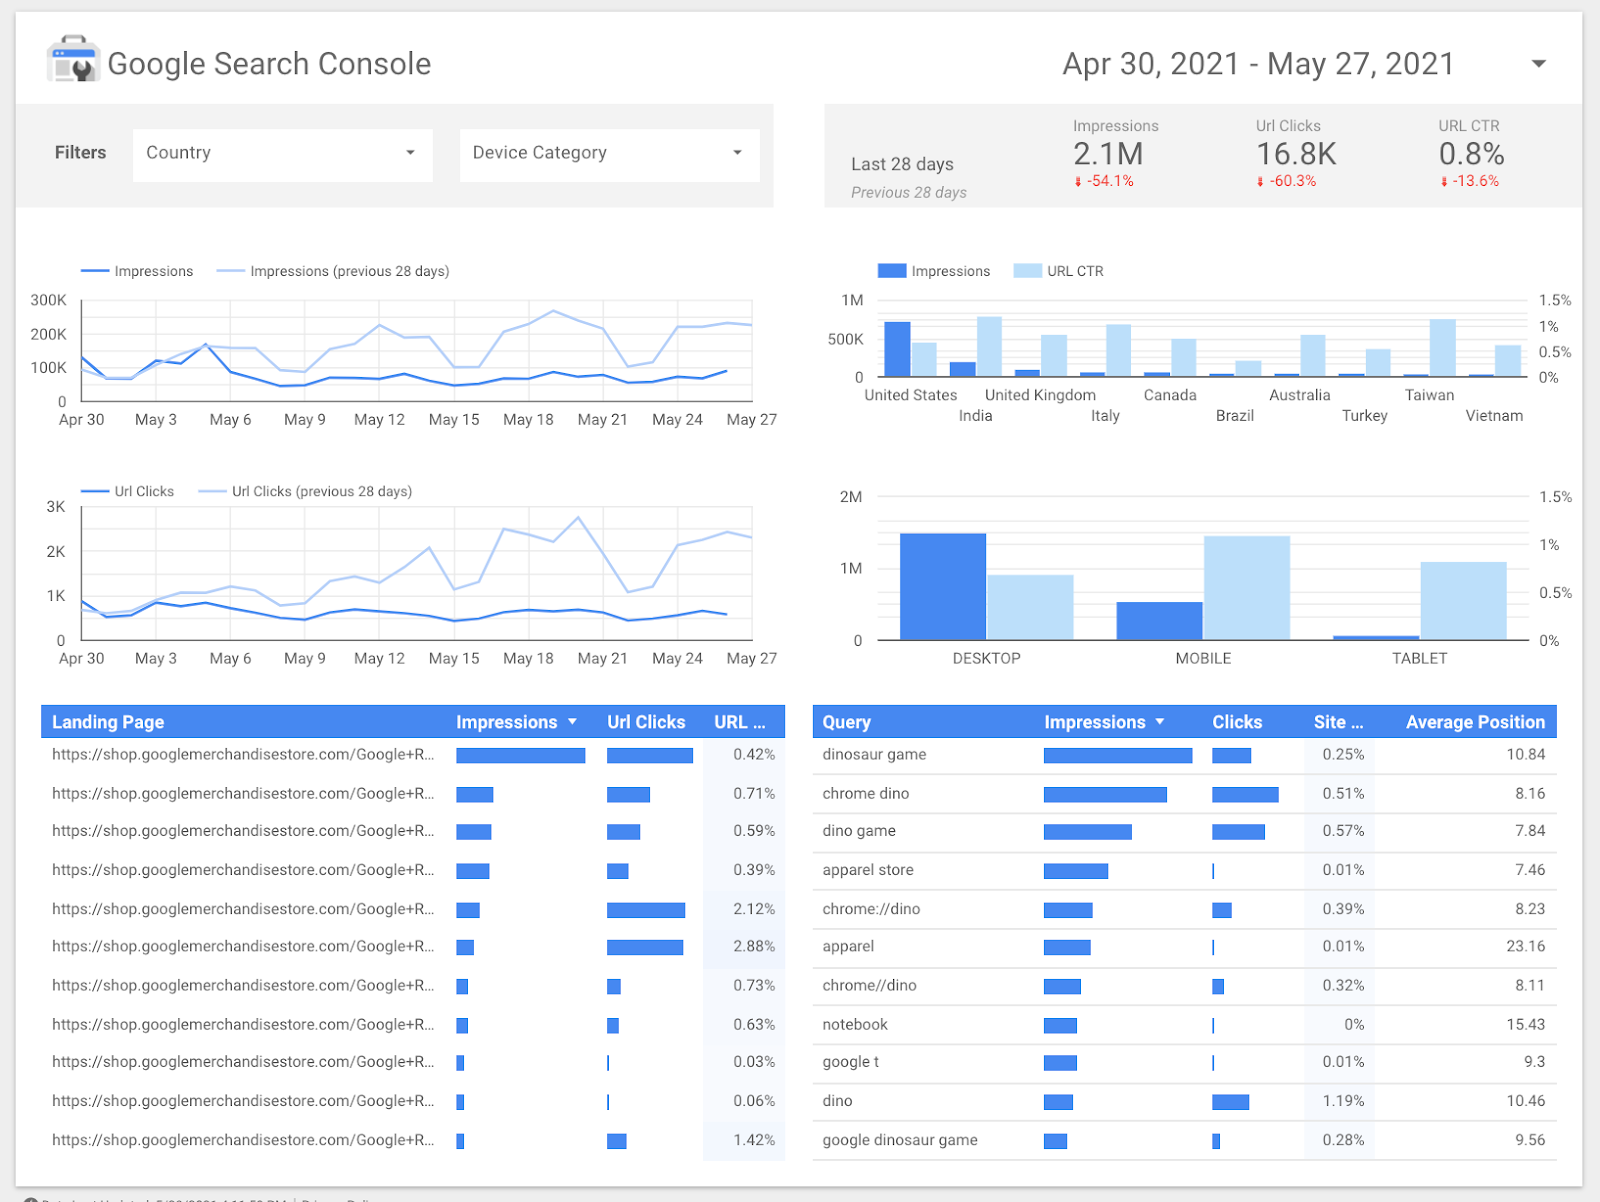
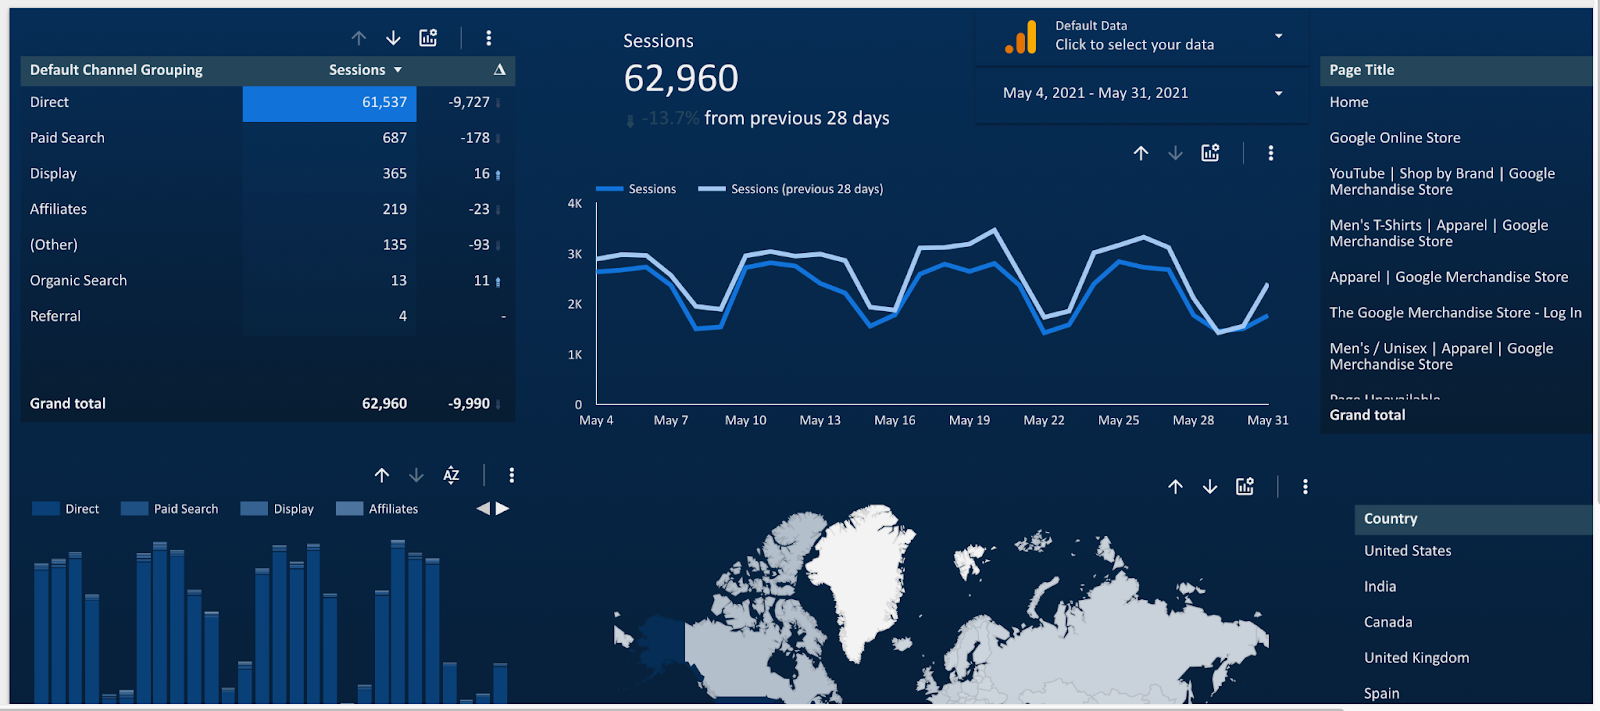
Into this:
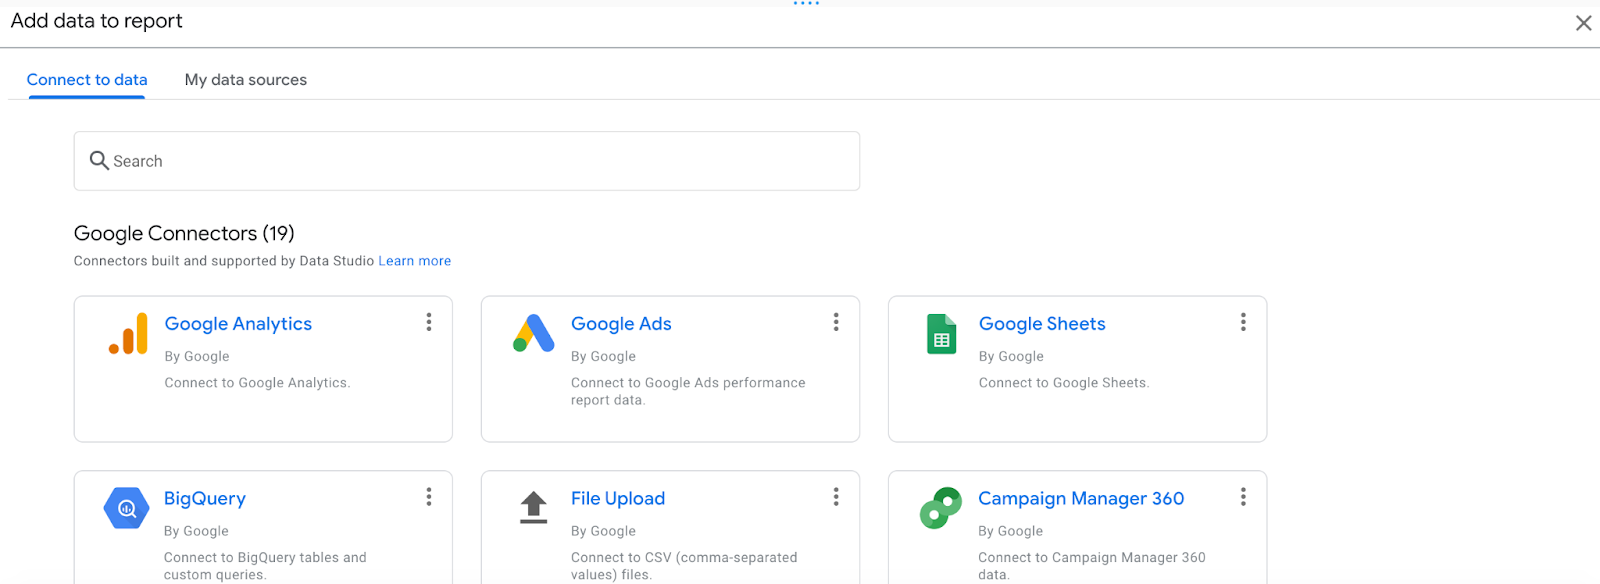
Also, you can add data from a variety of sources, as you can read in the Data Studio Help Center. These are some of the available options:
- Google Marketing Platform products, including Google Ads, Analytics, Display & Video 360, Search Ads 360
- Google consumer products, such as Sheets, YouTube, and Search Console
- Databases, including BigQuery, MySQL, and PostgreSQL
- Flat files via CSV file upload and Google Cloud Storage
- Social media platforms such as Facebook, Reddit, and Twitter
But, that is not all; you can also share and collaborate your reports with individuals or teams that can either view or edit the file.
So, what do you need to get started?
-
Sign in to a Google account
-
Be in one of the supported countries
-
Accept the Terms of Services and Policies
How can you use Google Data Studio in 2021?
Now that you know what Google Data Studio does, how can you use it in your company or project? Here are some ideas:
Create engaging reports
Whether it is for a business plan that you are building or delivering the results of a marketing campaign, you can undoubtedly benefit from Google Data Studio.
This tool provides a blank canvas where you can create single-page or multiple-page reports using a drag-and-drop tool. Plus, as we mentioned above, you can personalize it with your brand colors.
Also, you do not have to create the report every time you need it with updated data since it connects directly with your database; it updates on its own.
![]()
1. One report to rule them all
Another great feature that Google Data Studio has is that it allows you to combine multiple data sources into one report. Therefore, you do not need to create separate reports. In other words, it makes your life easier and report-making faster.
Save time with this tool so you can focus on other relevant tasks your business requires.
Some of the data sources can be Search Console, Google Ads, YouTube, and Campaign Manager. But that is not all; you can also use third-party data sources, such as Adobe Analytics, AdRoll, Asana, Amazon Ads, and AdStage. In total, there are more than 120 options.
2. Share and collaborate
Just as it occurs with all of Google’s products, you can give permission to different people inside or outside your team to view the reports. Besides, you can work on it collaboratively in real-time by providing editing privileges.
There is no need to save an Office file, send it over email or share it through a flash drive to have someone else edit it and send it back again. An entire team of people can work on one report simultaneously.
3. Use tables any way you want
Add different dimensions and metrics to tables to get the data you need for your report. You can also add a summary row that gives you grand totals. Also, adjust how many rows you want to show per table, and filter dimensions.
Besides using tables in many different ways, you can also personalize everything from colors, fonts, add your logo, background image, and anything you need to make the report you are looking for.
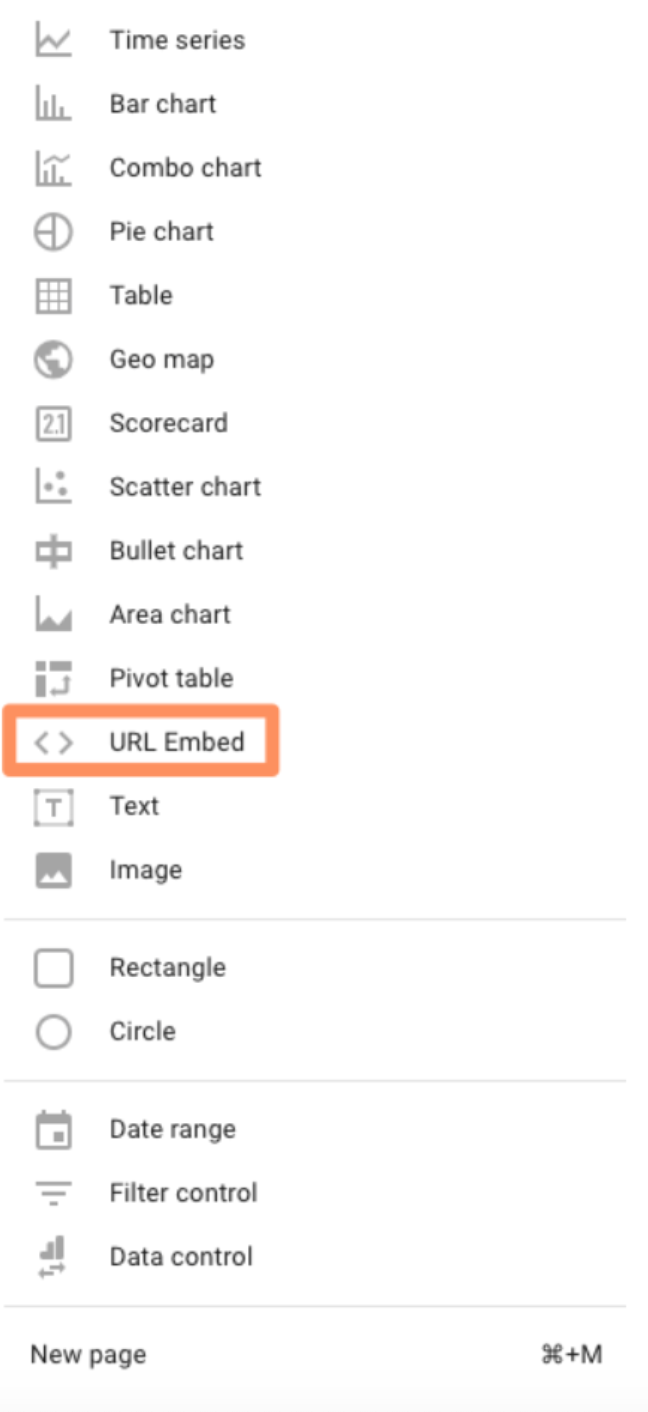
4. Embed external content
Besides adding data, you can also embed external content, such as Google Docs, Google Sheets, YouTube videos, and entire live web pages. This creates an interactive report, much more than any PowerPoint presentation can give you.
5. It is FREE
Another great reason to start using Google Data Studio in 2021 is that it’s free. Yes, just as you read it. This tool does not cost a cent, and there is no limit on how many reports you can make with it.
So, instead of spending hundreds on similar tools, why not try this one out first? Enhance your reports, save time, money, and create an interactive experience with a very easy-to-use tool.
Metrics you can use with Google Data Studio
In Google Data Studio, you will find dimensions and metrics. Dimensions refer to what you are measuring or what you are measuring by, and metrics are measurements.
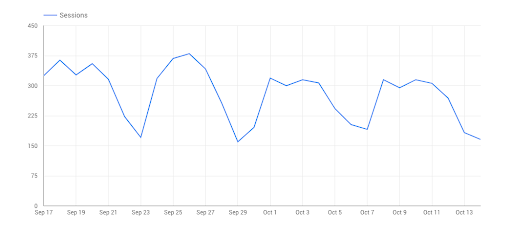
For example, if you are looking at website traffic overtime on a chart, the dimension will be time (what we are measuring by), and the metric the sessions (traffic), which is a number that we can quantify.
You can see this in the following chart where time is on the X-axis and traffic on the Y-axis:
In this example, you can see traffic sources divided in a pie chart. Once again, the metrics are the number of sessions, and the dimensions are the sources.
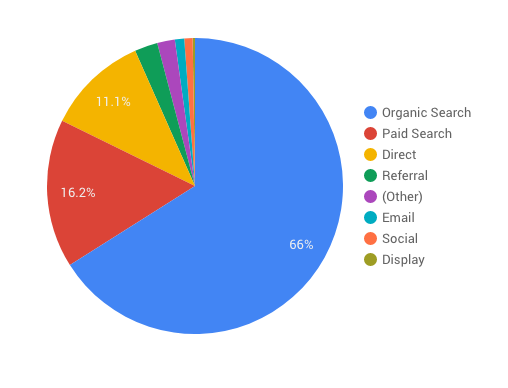
Metrics will always be a number, something that is quantifiable, and dimensions are just words. You cannot quantify social, for instance.
In Google Data Studio, metrics are always blue, and dimensions are always green, so it is very easy to set them apart when you are creating reports.
There are four different types of dimensions in Google Data Studio:
- Data source schema specific dimension: It is a regular dimension of a data source schema. If your report is using a data source schema, it will be available.
- Data source schema specific calculated dimension: It is a dimension that can perform certain actions on other fields in your data source via a formula.
- Chart specific dimension: It is a regular dimension of a specific chart in a report.
- Chart specific calculated dimension: It performs certain actions on other fields in your chart via a formula. It is only available on the chart where you created it.
As for metrics, Google defines them as “aggregations that come from the underlying data set, or are the result of implicitly or explicitly applying an aggregation function, such as COUNT(), SUM(), or AVG(). The metric itself has no defined set of values, so you can’t group by it, as you can with a dimension.”
The dimensions and metrics you need in your report will depend on the report itself and what it is about. For example, a report about website performance may include the dimension “city” and the metrics “sessions” and “pages/session.” Or it could include the dimension “browser” too if you need this information in your report.
Now that you know what you can use Google Data Studio for, you are prepared to check it out and start creating your first interactive report for your client, coworkers, or executives.
Google Data Studio reports for inspiration
Here, I have selected five of my favorite Google Data Studio reports from the software’s gallery, where you can find inspiration and ideas for your own reports:
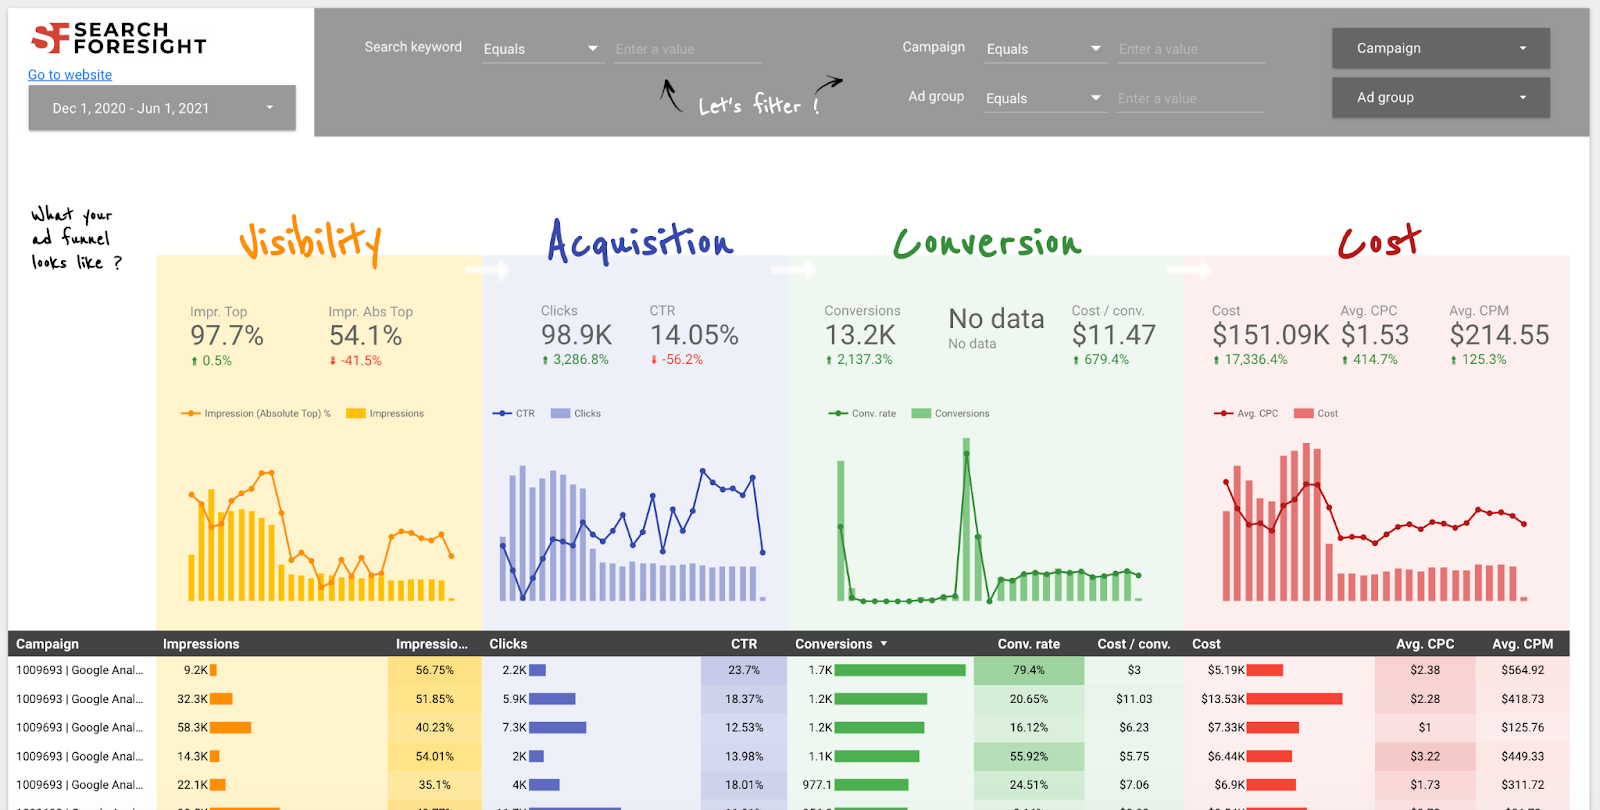
Google Ads monitoring report
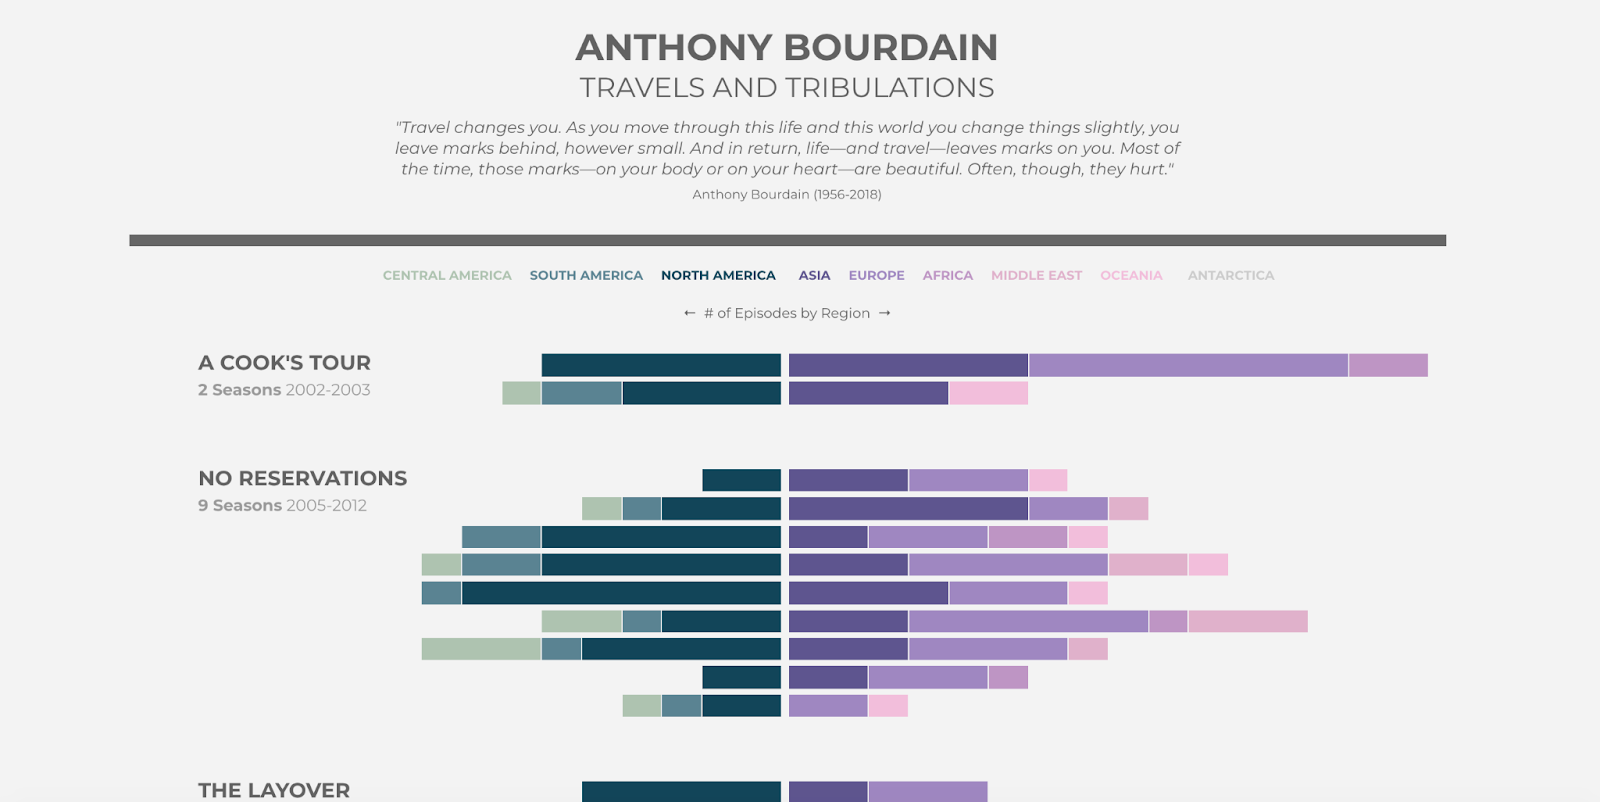
Anthony Bourdain number of episodes by region
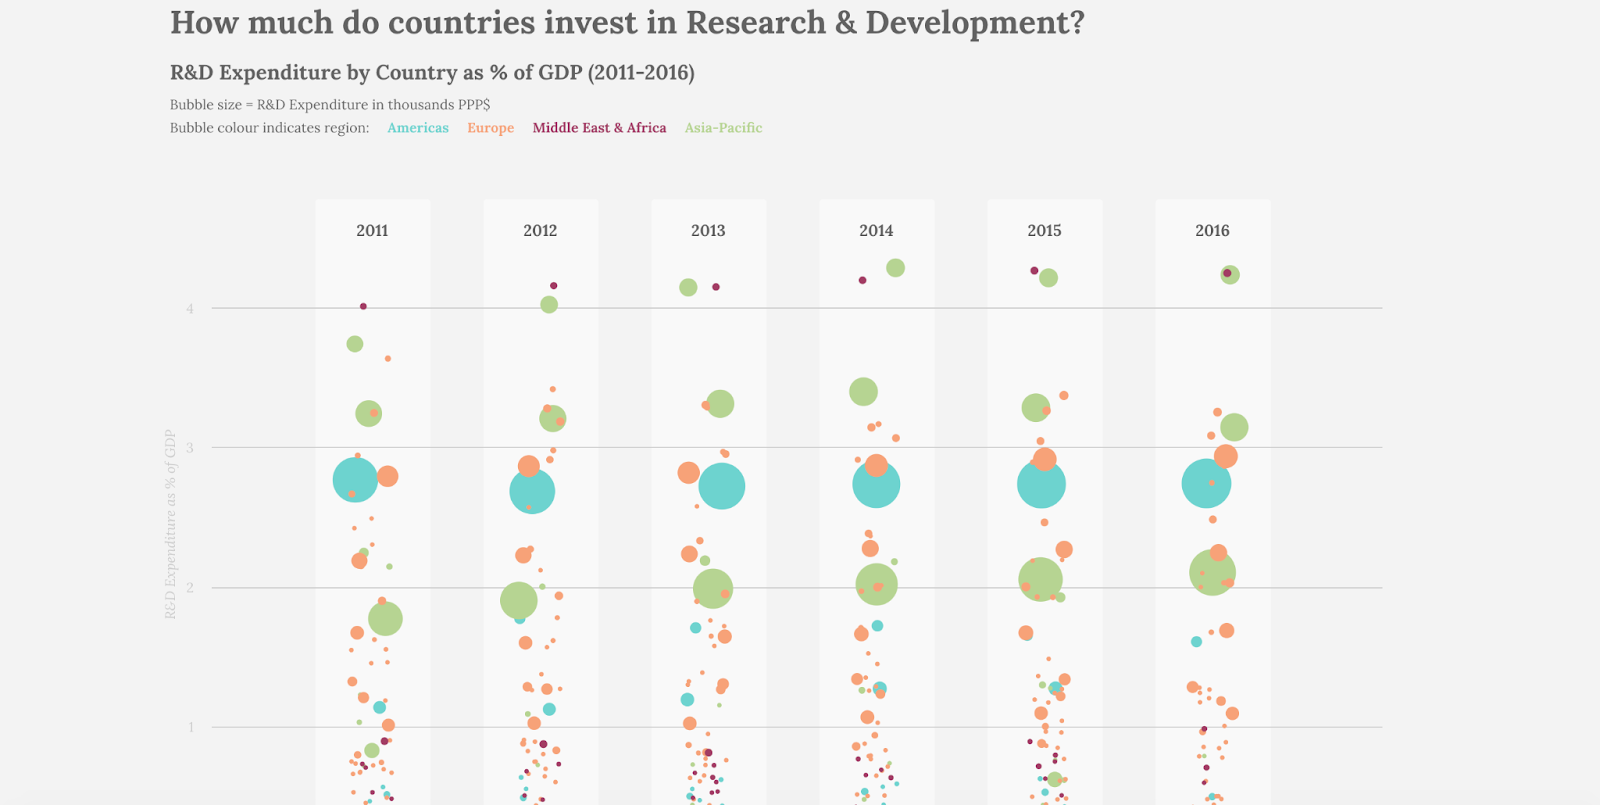
How much do countries invest in Research & Development?
Website and marketing performance
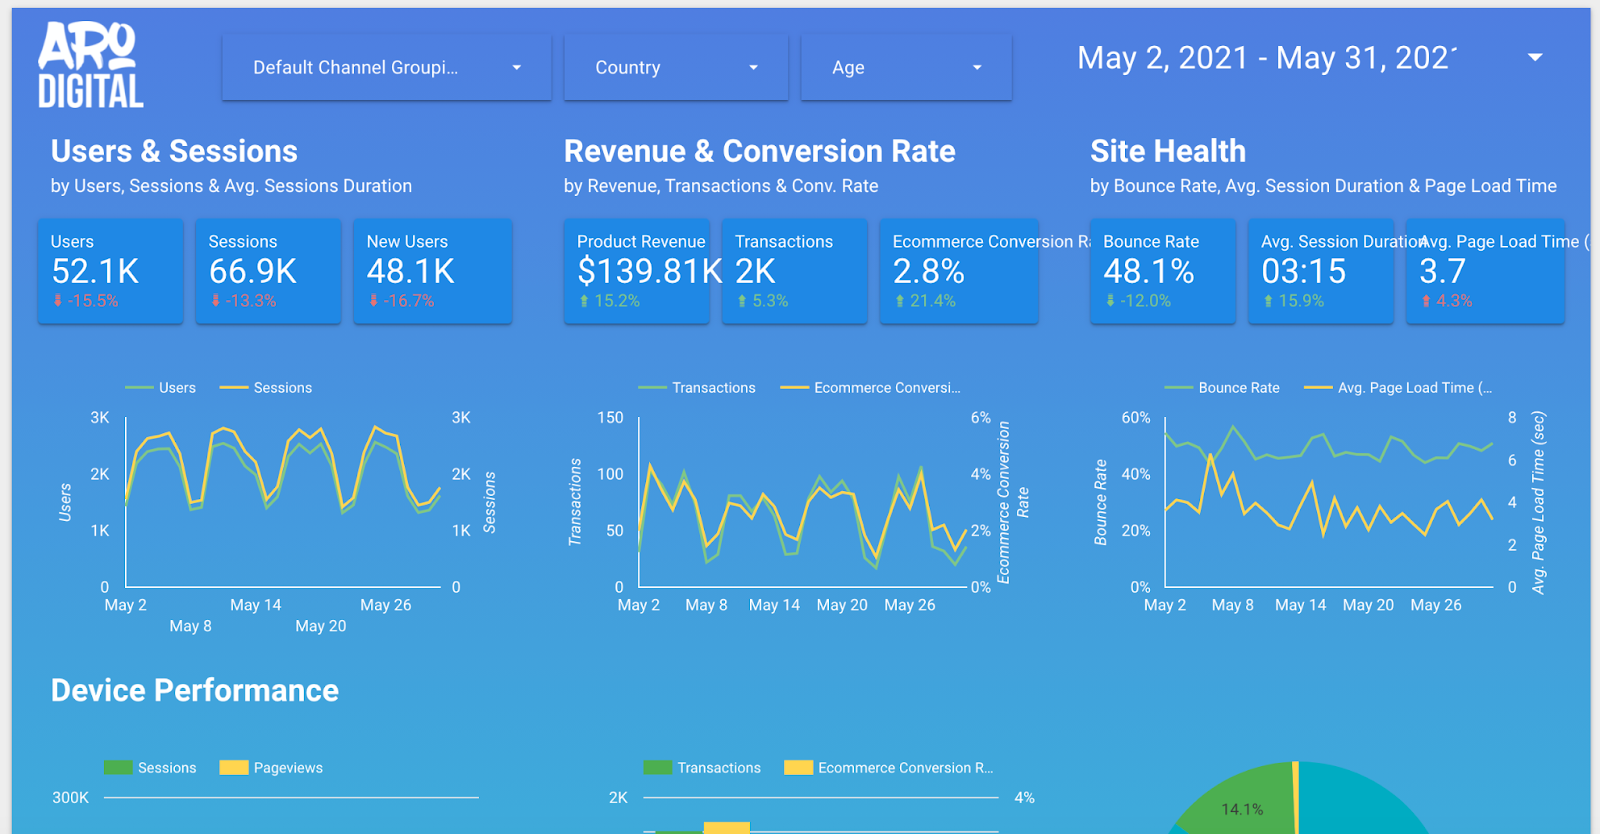
Google Analytics overview
Ermelinda Maglione is a journalist and specialist in digital journalism. She has more than 15 years of digital writing and copywriting experience, especially in marketing, social media, and SEO. Currently, she is a Content Marketer for Venngage.

Grow Your Business with Profitworks!
Profitworks Small Business Services provides website traffic and website conversion optimization services to increase the number of sales generated from a website. The focus of our services is on increasing sales and providing a positive return on investment!
If you are interested in getting new customers for your business, contact us today!
You can also download our Closed-Loop SEO Marketing Services Brochure or our free SEO checklist by clicking on the links!
What Profitworks Customers Are Saying: