Increase Business Sales By Using A Free Website Heat Map Tool
A great way to increase business sales is to have a lead capture form on your website. A lead capture for is a page where you get visitors to your website to give you their contact information by entering it into a form that automatically collects it for you. You can't just expect website visitors though to give you their contact information, usually you need to give them something of value in return their contact information. Things like a free report, white paper or access to special information or offers. An example of a lead capture form I have created can be found at http://www.profitworks.ca/free-marketing-plan-form. Recently I have been collecting heat map data on one of the pages that leads people to my lead capture page. Heat map data basically shows you where visitors to your website move their mouse, click and scroll. In this blog article I review how you can use this information to get more leads, which you can turn into more customers. The more leads you have, the more customers you should be able to get.
For this blog article I am using results provided by ClickTale.com. I just recently started using ClickTale, but from what I can see it looks like a really good program for a program that you can get for free. There are some limitations with the free version but I have definitely been able to benefit from using the free version.
Next Step To Capture More Leads
As a result of looking at where the majority of the mouse moves are going it is clear I should put a button or link close to the "Benefits Of Profitworks' Free Marketing Plan Template" heading to entice more clicks. It is clear the eye is drawn there. There was even a click that took place above the title. The data also indicates though that it might not be good to move the "Get It Now" button from its current location as that section of the page is getting the highest amount of scrolling attention and time of engagement at an average of 23 seconds. It is interesting that the amount of engagement quickly falls off after the "Components" heading. This indicates it may be worth while placing the "Why Every Small Business Should Have A Business Plan" above the "Components" section. It is also interesting that the the "Get Our Free Marketing Plan Template" link at the bottom of the page got a lot more clicks than the "Download It Now!" link at the top of the page. This indicates that the link at the top of the page should be tested with the text "Get Our Free Marketing Plan Template" text to see if it results in higher click through.
So how did I get this information to make these conclusions? Below are the screen shots of the heat map data I analyzed.
Mouse Movement Tracking
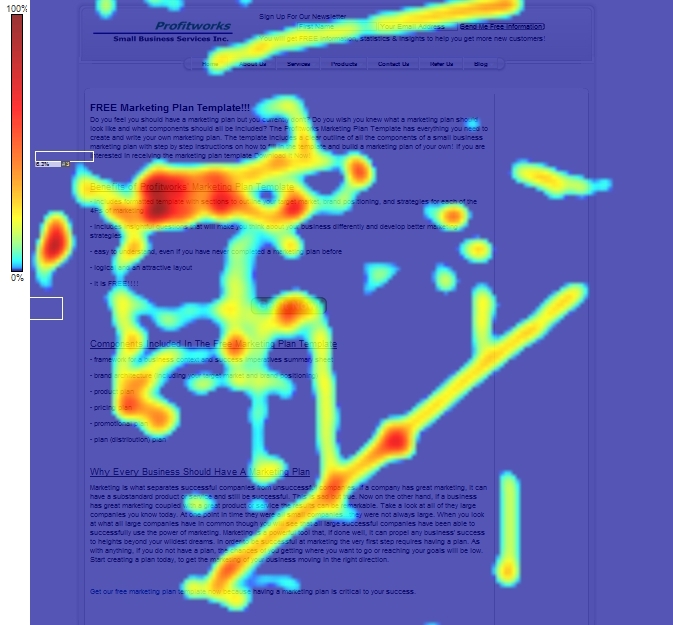
To read this chart you needs to understand the coloring. This picture shows the color coding. As you can see the more red the color the more mouse activity, which the blue/burgundy color being the most activity.
After reviewing the mouse movement stats it is interesting to point out that there is a fair bit of activity by the benefits section, the components section and the get it now button. There is also very little activity by the page title, the introductory paragraph and navigation bar. At the navigation bar there is activity but very little for a navigation bar. This is good and means the page is doing its job on having visitors focus on downloading the marketing plan and not going to other pages. It appears I do not need to worry about removing the navigation from my landing pages.
Click Tracking
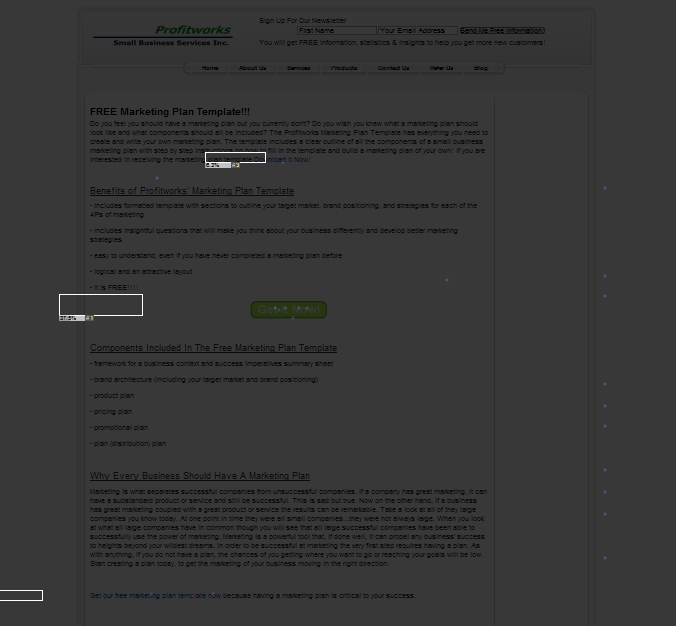
The clicks are marked by small blue dots. As you can see there are a lot of them on the "Get It Now" and a few at the bottom of the page. You can also see a few other random clicks in other locations as well as the clicks at the side of the page to try and scroll up or down the page. Each major clickable link area also has a box around it and shows the amount of clicks that area received. The link at the top of the page got 6.3% of the clicks, the button got 37.5% of the clicks and the link at the bottom got 25.0% of the clicks.
Scrolling Tracking
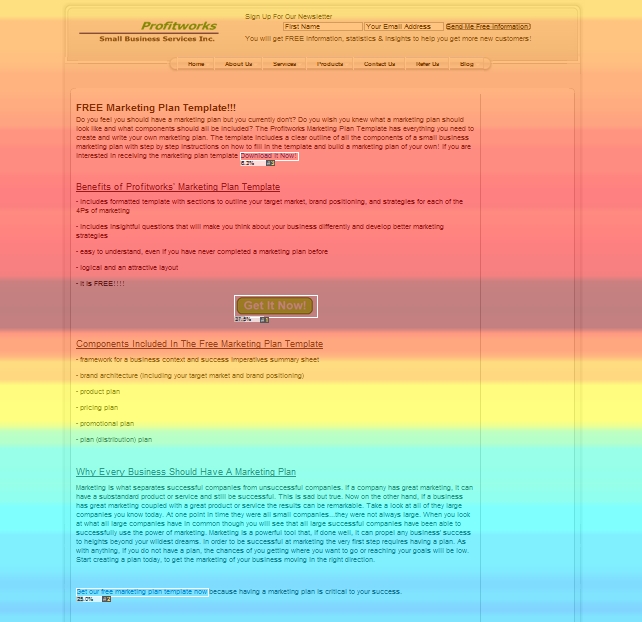
The scroll tracking or attention tracking display shows what horizontal sections of the webpage got the most attention and time of engagement. With ClickTale as you move the mouse up or down the page it will tell you the average time of engagement for that horizontal area of the page and the percentage of visitors that did at some point view that area of the page. Therefore 100% of the visitors will have viewed the top of the page but as you go down the page less and less of the visitors will have seen that part of the page. In this example only 68.8% of visitors went all the way down to the bottom of the page where the Profitworks logo is and the "Follow Profitworks On Linkedin" button is, yet 81.3% of visitors made it down to the last link of the page which is just up a little bit from the very bottom. For time of engagement the dark blue/burgundy section by the button got the most time of engagement at an average of 23 seconds. Above this area it is all about 18-20 seconds. The time of engagement quickly falls off though as you go down the page. In the 2nd to 5th point of the components section the time of engagement is only 10-14 seconds, depending on what line it is, and the time spent from the why every business should have a business plan to the social buttons ranges from only 7.0-9.75 seconds. Additional data is also provided for the clickable areas when you hover your mouse of the area. Below are the stats for each. As you can see each has a perfect hover conversion so the page is doing a good job of getting people to click once it gets them to put there mouse on the clickable area. From this data we can also see that there was 11 clicks and at the top of the page (not shown in the picture) we also know that there were 16 page visitors in total. That equates to a 68.8% conversion with is outstanding, considering most reports will tell you that average conversion rates for lead capture pages are between 5 and 30%.
|
First Link Time On Click = 55.4 seconds Hovers = 1 Hover Time = 0.6 seconds Hover Conversion = 100% |
Button Time On Click = 15.1 seconds Hovers = 6 Hover Time = 1.1 seconds Hover Conversion = 100% |
Second Link Time On Click = 22.1 seconds Hovers = 4 Hover Time = 0.6 seconds Hover Conversion = 100% |
I am going to make the changes I discussed earlier and continue to track the results to see what happens. Be sure to check back to see how much these changes improve results. As you can see heat map data can be very useful to analyzing lead capture forms on your website. If you are able to improve the results by 10% you will get 10% more leads and should see an increase in the revenues you obtain from your lead capture efforts by 10%. The degree by which you can increase business sales by using heat map information is limitless. Ensure you are utilizing heat map technology on the most important pages of your website like your homepage and lead capture forms.
Other Related Articles You Might Be Interested In
1. Effective Facebook Advertising Tips
2. Small Business Marketing - 5 Key Components
3. Cost Per 1,000 Impressions - Facebook, Linkedin, Google Adwords
4. Cost Per Click vs Cost Per Impression

My name is Chris R. Keller. I work at Profitworks Small Business Services helping various B2B small businesses in Waterloo and Kitchener Ontario generate new customers. Feel free to connect with me on Google+ or if you are just interested in getting new customers for your B2B small businesses enter your email in the box provided below and click the "Send Me Free Updates" button.
I hope you have enjoyed this article on how increase business sales by using a free website heat map tool. If you enjoyed this article I would greatly appreciate you +1 this article or add us on Google+, Linkedin or Facebook by clicking on the buttons below. Thanks again for reading.